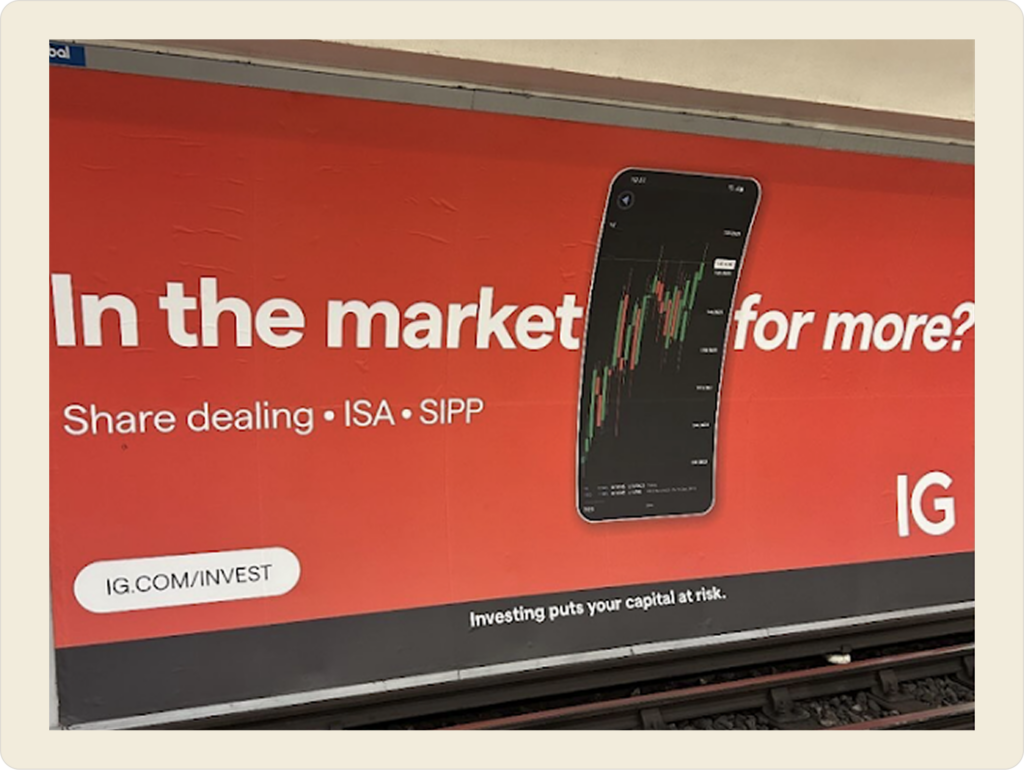
Financial charts were one of the most critical experiences within IG’s trading platform, helping traders analyse markets and make informed trading decisions.
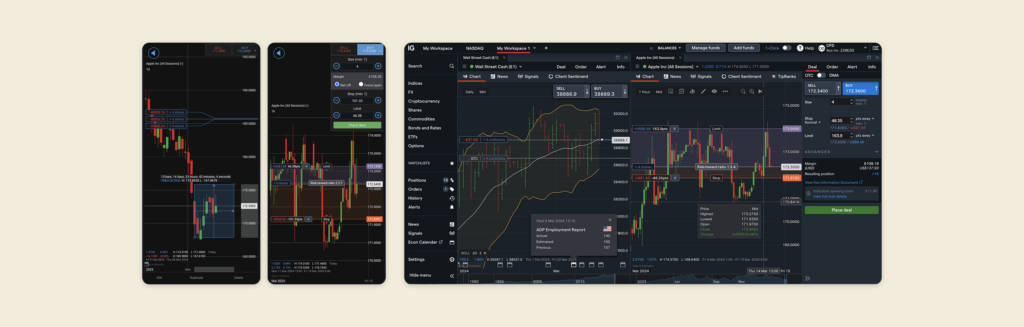
Over 9 years, I shaped the evolution of the charting experience across web, iOS and Android – from defining long-term product vision to designing new analytical tools, interaction patterns and scalable design standards.
My role
I owned the design direction of Financial Charts, working closely with Product, Engineering, analysts and regional stakeholders.
My responsibilities included
- Defining the long-term product vision
- Designing new chart analysis tools and interactions Improving usability across web and mobile
- Aligning the experience through reusable patterns and design guidelines
- Translating complex trading requirements into intuitive workflows
Design approach
Every improvement was grounded in user needs and business priorities. To identify opportunities, I combined:
- Customer research
- Product analytics
- Customer support insights
- Competitive analysis
- HCI methodology
- Workshops with regional teams and market analysts
This continuous discovery process informed both incremental improvements and the long-term product vision.
Key outcomes
Over multiple releases I helped evolve Financial Charts into a more powerful and intuitive analysis tool by:
- Improving chart interactions and usability
- Introducing advanced drawing and indicator capabilities
- Creating a scalable style guide for charts and data visualisation
- Establishing reusable UI patterns across analysis tools
- Supporting both novice and professional traders with flexible chart customisation
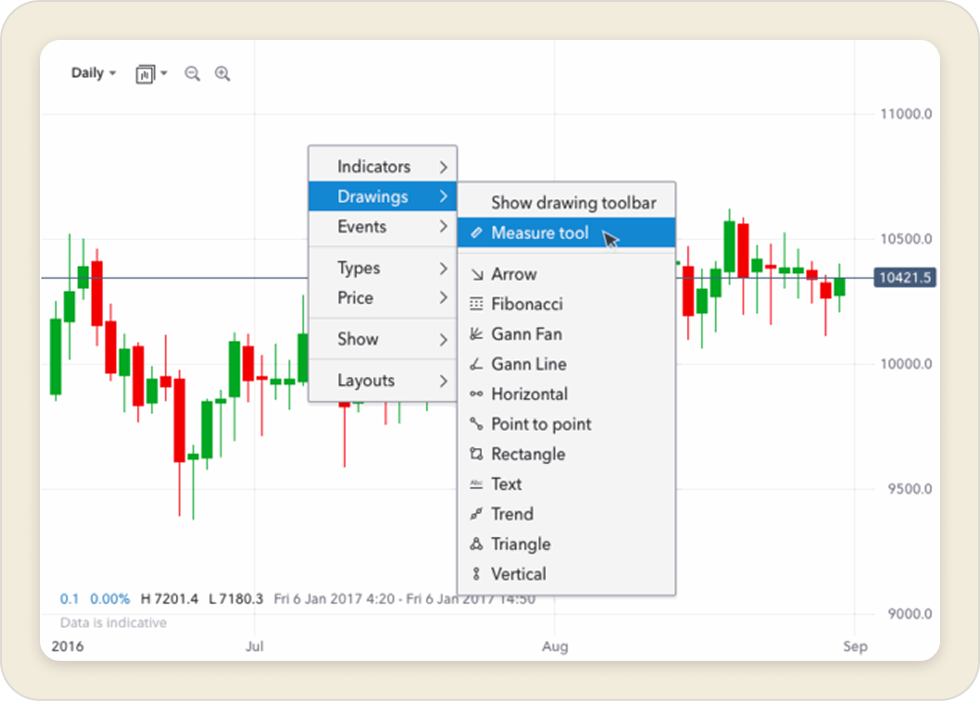
Indicator & Drawing Settings
Simplified configuration through a unified editing experience, colour management and reusable controls.
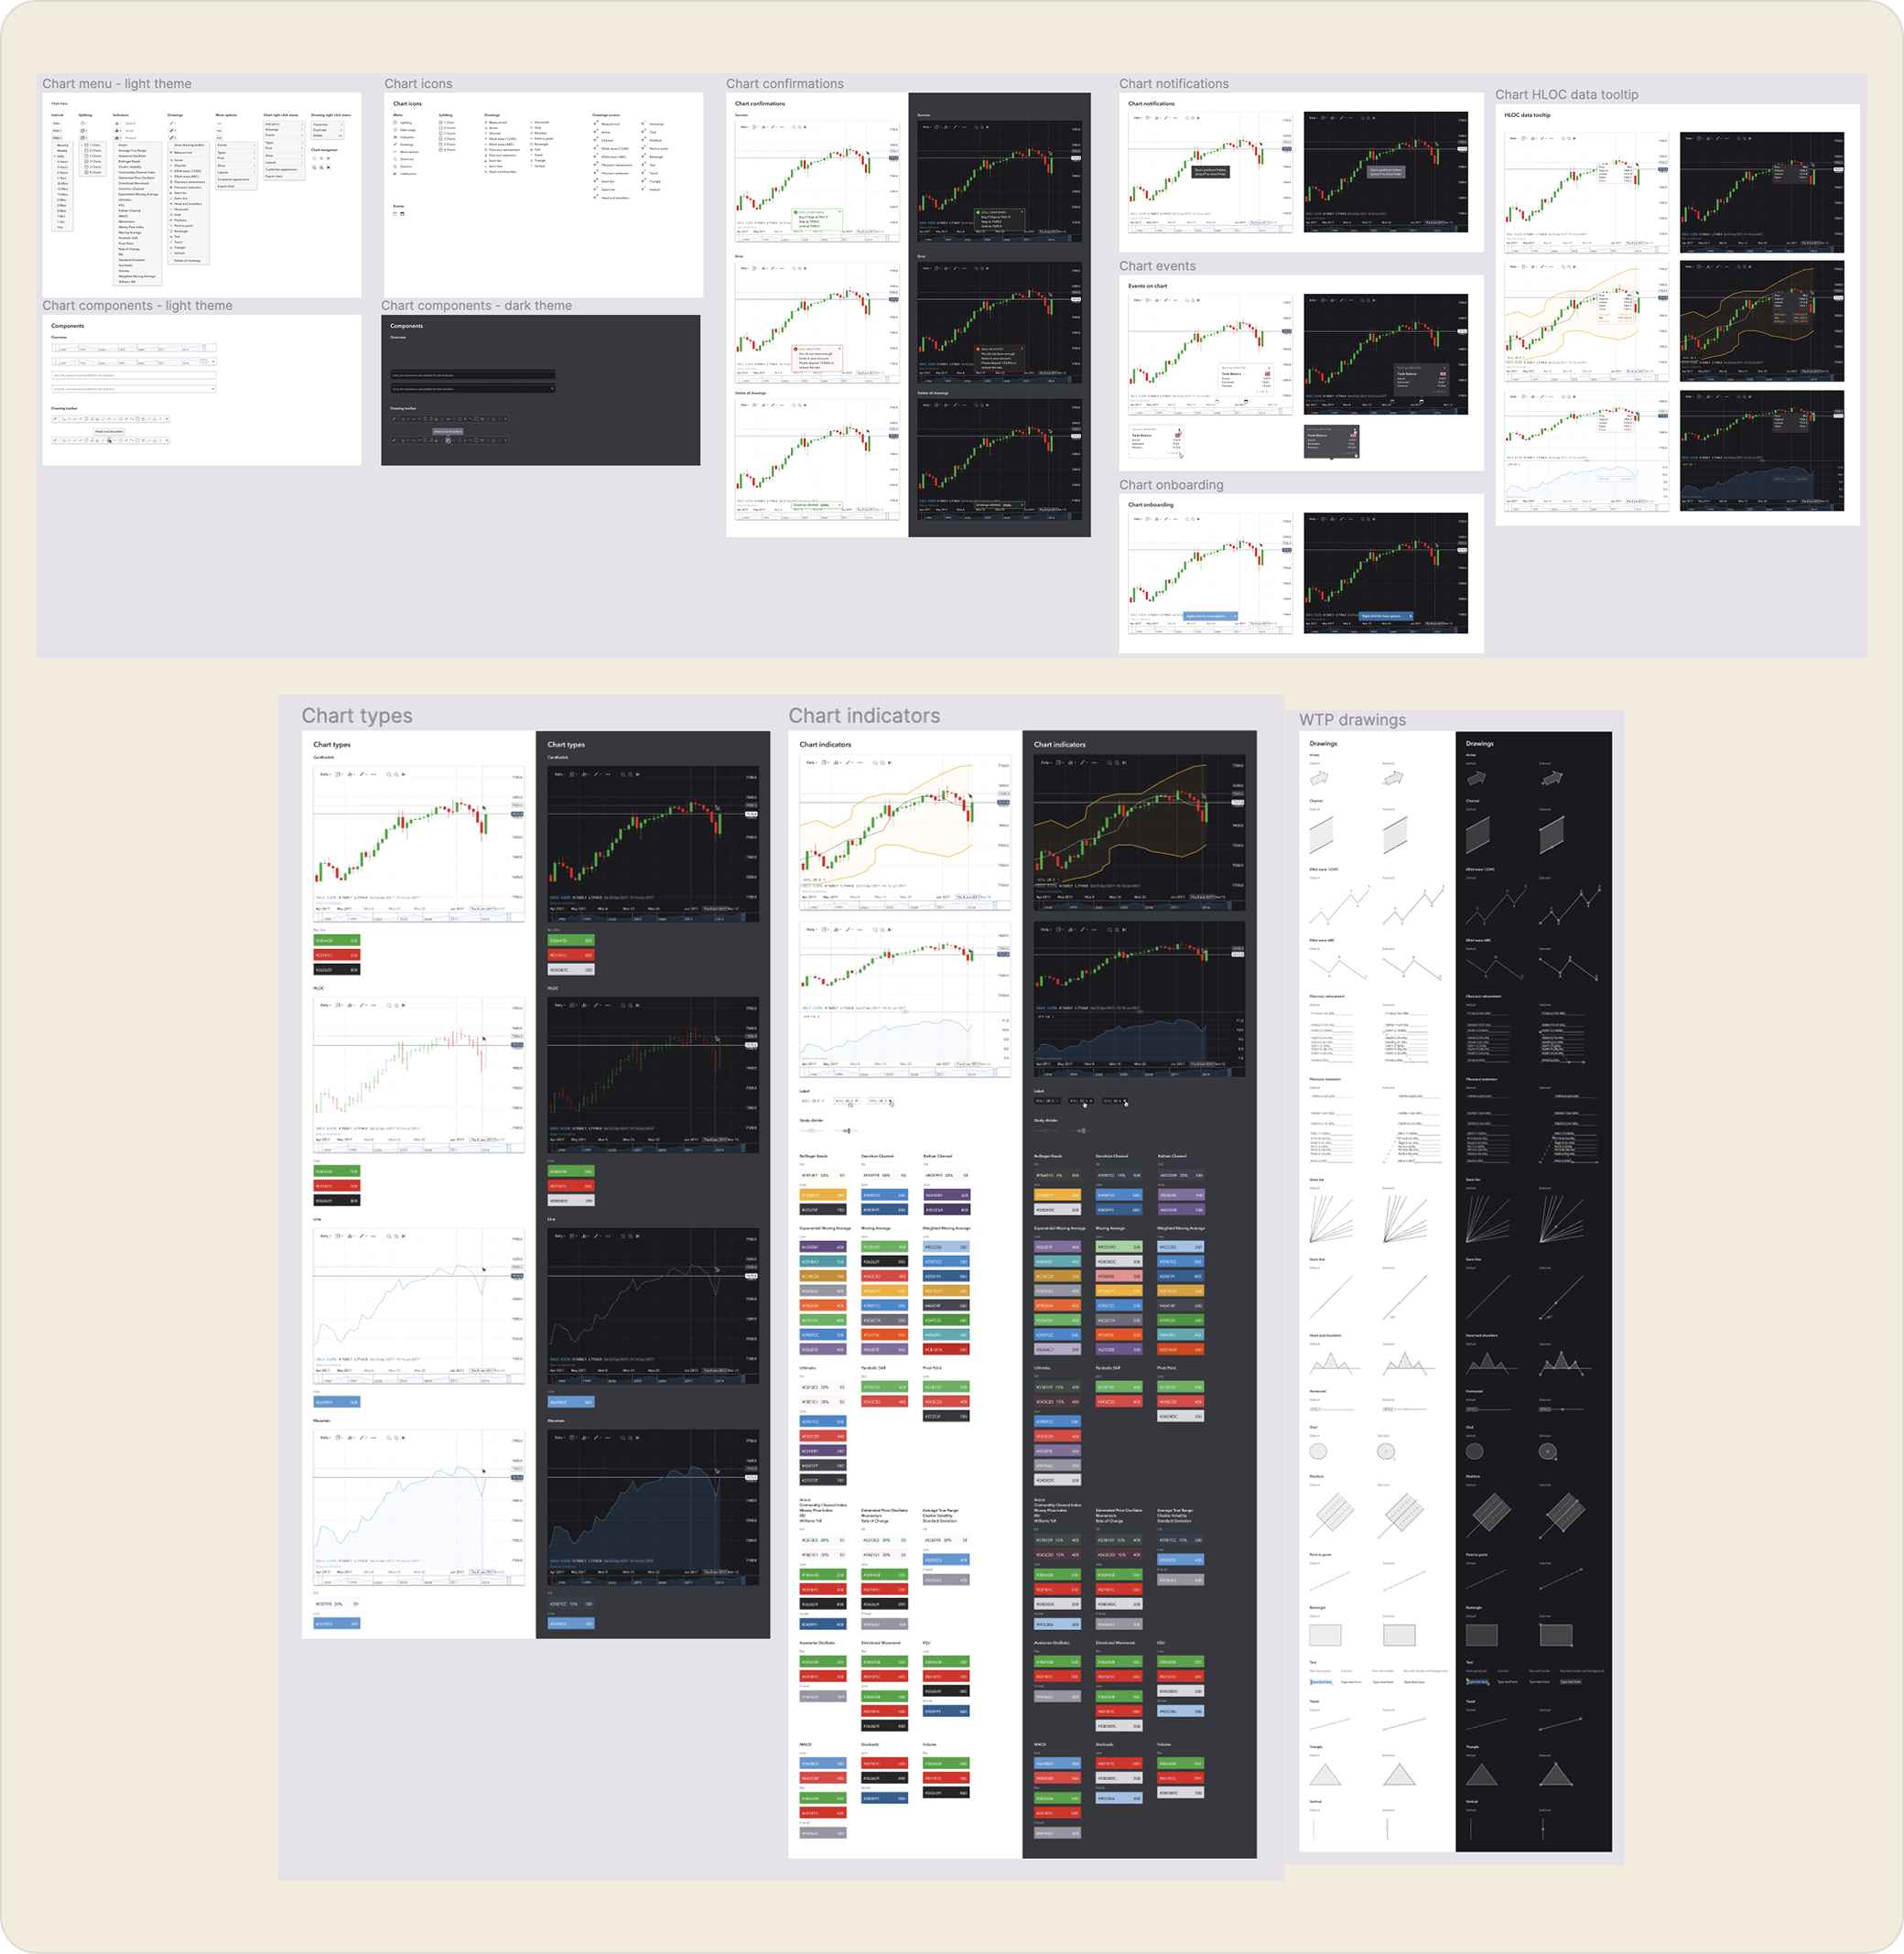
Financial Charts Design System
Created reusable principles and components to ensure consistency across charting features.
Business impact
Financial Charts became one of IG’s flagship product experiences, frequently featured across product launches, marketing materials and educational content.
The charting experience played a key role in demonstrating IG’s analytical capabilities and supporting traders throughout the research and trading journey.